
Key Findings from the 2022 Community Health Survey
Download the 2022 Community Health Survey Key Findings
The 2022 Larimer County Community Health Survey was the tenth triennial survey conducted by the Health District of Northern Larimer County. The survey instrument contained 74 multi-part questions to collect data from adult residents of Larimer County on a variety of health conditions and behaviors, healthcare affordability and coverage, access to healthcare, and need for various services.
A total of 2,700 useable surveys were returned, resulting in a response rate of 21%. There were 1,645 surveys (61%) received from residences within the Health District boundaries and 1,055 from south Larimer County. Data was weighted by demographic information, such as age, gender, education, and more. This is a common statistical technique used to improve the accuracy of representation in the survey sample. When available, 2022 results are compared with results from previous surveys; however, not all questions were included on earlier surveys. Due to differences in household sampling methods and how the data was weighted, some caution is needed when looking at trends.
This report includes a high-level summary of both positive health indicators and areas of potential concern on the following topics:
Physical Health
In 2022, residents reported lower overall health status and more days in the past month (3 days vs 2019: 2) of poor physical health impacting the ability to do usual activities like work and recreation.
Chart 1. Overall, would you say your health is ... ?

Chart 2. Chronic Conditions by Race/Ethnicity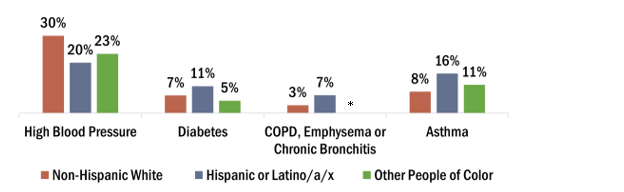
*Data masked due to less than 5 responses
|
Prevalence of asthma, COPD and diabetes was 2 to 3 times higher in Hispanic or Latino/a/x residents than non-Hispanic white and other people of color. |
About 7% of adults have high impact pain (pain most or every day and pain that limits life or work most or every day in the last 6 months). Some groups affected disproportionately are transgender and non-binary adults (20%), residents in households ≤250% of the federal poverty level (FPL) (lower income) (17%), those 65 and older (11%), and Hispanic or Latino/a/x adults (10%).
The share of adults in Larimer County within the normal BMI range has declined slowly since 2010. The share considered overweight is consistently above 30% and many more are in the obese BMI range, above 20% for the first time (since 1995).
Chart 3. BMI by Survey Year

Chart 4. Obesity Prevalence

Daily servings of fruits and vegetables, considered a key component of a healthy diet, are down, with just one in three adults consuming the recommended 5 or more servings.
Mental Health
There have been declines in mental health status since 2013. In 2022, respondents reported an average of 4 1/2 days in the past month when their mental health was not good - a full day more than in 2019.
More young adults (ages 18-34), transgender and non-binary adults and those in households ≤250% FPL have days of poor mental health compared to all local adults while most of those 65 years or older claim no poor mental health days. Also, 30% of adults get too little sleep (less than 7 hours), compared to 25% in 2019.
Chart 5. Average Days in the Past Month when Mental Health was Not Good

*Data not collected in 2010
More young adults (ages 18-34), transgender and non-binary adults and those in households ≤250% FPL have days of poor mental health compared to all local adults while most of those 65 years or older claim no poor mental health days. Also, 30% of adults get too little sleep (less than 7 hours), compared to 25% in 2019.
Chart 6. Days in the Past Month with Poor Mental Health by Selected Characteristics

More adults shared that they have been diagnosed with a mental health disorder (2022: 37% vs 2019: 30%) and 36% have been diagnosed with depression and/or anxiety. Young adults report the most mental health challenges, including stress and considering suicide.
- 7 days in the past month when mental health was not good
- 4 days in the past month when poor mental health limited usual activities
- 37% with a depression diagnosis
- 42% with an anxiety diagnosis
- 51% with depression, anxiety or another mental health disorder diagnosis
More adults reported that they, or someone in their household, needed mental health counseling/treatment and got treated in the past year (2022: 24% vs 2019: 22%). However, more also said that the needed help was not received (2022: 12% vs. 2019: 8%).
|
Eight percent are often stressed. Some groups disproportionately claimed to deal with stress nearly all the time; among them are young adults (16%), those in households ≤250% FPL (15%) and non-Hispanic/Latino/a/x people of color (15%). |
One in five adults from lower-income households experience forms of social isolation and 53% of them have support in only one or none of these areas.
- 12% of all adults rarely or never have someone to confide in; 21% of those in households at or below 250% FPL rarely or never do
- 12% of adults rarely or never have someone to take them to the doctor; 25% of those in households at or below 250% FPL rarely or never do
- 12% of adults rarely or never have someone to have a good time with; 22% of those in households at or below 250% FPL rarely or never do
Substance Use
Alcohol:
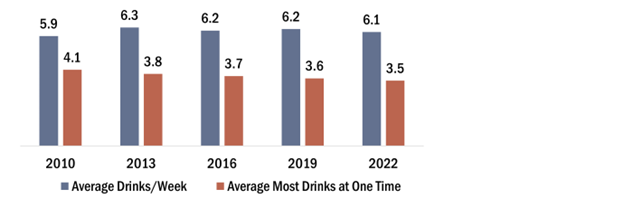
Use of alcohol is down slightly (2022: 59% any regular alcohol consumption vs 2019: 62%). Not including those who abstain, the average most drinks at one time is 3 ½. However, about 1 in 5 adults still report binge drinking.
Chart 7. Alcohol Consumption
Overall, 5% of adults have been told by a healthcare provider that they have a substance use disorder. This is much higher for transgender and non-binary (14%) and Hispanic or Latino/a/x (13%) adults.
After a concerning spike in 2019, adults who report in the past month having one or more instances of driving after drinking 2 or more alcoholic beverages has returned to 4%.
Chart 8. Drinking and Driving: 2004-2022

Cannabis:
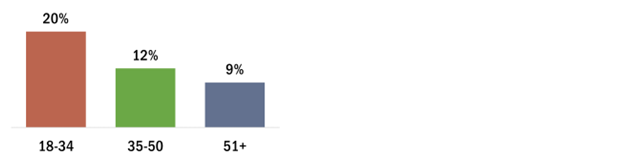
One in 5 adults (22%) report using cannabis in the past month, and they are using it on more days each month. Daily users grew from 27% in 2019 to 32% in 2022 and the average number of days of use per month increased from 14 to 17 days.
Chart 9. Cannabis Use by Age

Chart 10. Frequency of Cannabis Use in the Past 30 Days by Age

Most adults who recently used cannabis did so to reduce stress and relax or to improve sleep.
A larger share of young adults use cannabis to treat depression/anxiety or to get high/for fun than any other age group.
Chart 11. All Adults vs Young Adults Use

Tobacco:
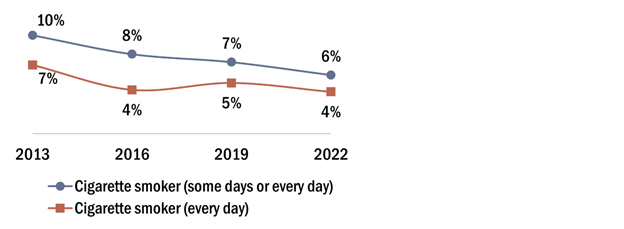
Regular (combustible) cigarette use continues to drop (1995: 18%). Seven in 10 cigarette smokers are seriously considering quitting.
Chart 12. Cigarette Use
E-cigarette (electronic vaping product with nicotine) users have grown (2019: 4% vs 2022: 6%). Again, most (61%) are seriously thinking of quitting. Of those who vape/use e-cigs, 42% do so to quit or reduce regular cigarette use.
Use of other tobacco products like cigars or pipes, and chew or spit tobacco remains near 3%. The majority (59%) of chew/spit users are seriously considering quitting, but just 30% of cigar/pipe smokers are.
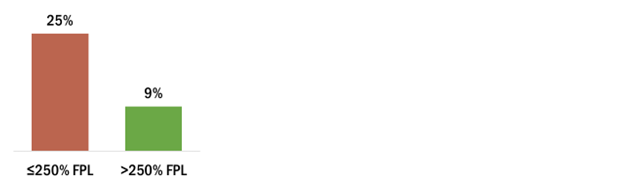
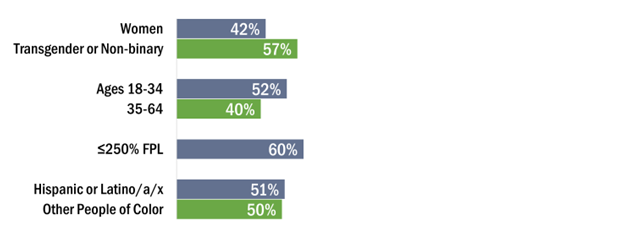
Fourteen percent of adults use at least one form of tobacco, but use is uneven across various demographics.
Chart 13. Tobacco Users by Selected Characteristics
A. Gender
B. Income
C. Age
Social Factors
Access to Care:
In 2022, fewer adults were very or somewhat worried about affording the care they need (40% vs 2019: 47%). Still, it was a concern for half or nearly half of some groups, such as adults other than men, under 65 years old, from lower income households, and people of color.
Chart 14. Very or Somewhat Worried They Can Afford Medical Care
Of adults who may have needed to see a doctor or a specialist in the past two years, 20% did not because they felt it was unaffordable.
Chart 15. Access to Care When Needed by Age Group

|
Environment:
Walking is easy to do, but more adults claim public transit can get them where they need to go compared to walking.
Chart 16. Transportation by Age

|
3 in 5 Hispanic or Latino/a/x adults feel they can get to places using public transit |
Following large fires in 2020 and 2021, not only do more adults call climate change and wildfires problems, but
- 66% say polluted outdoor air is a local problem; 6 percentage points over 2019
- 31% say unclean indoor air is a local problem; no change from 2019
- 36% say pollution from industry is a local problem; no change from 2019
- 60% say mosquitos are a local problem; 8 percentage points over 2019
- 74% say changing climate conditions are a local problem; 14 percentage points over 2019
- 84% say wildfires are a local problem; 25 percentage points over 2019
- 44% say floods are a local problem; 1 percentage point below 2019
Fifty percent believe a wildfire disaster could impact their households in the future. Nearly 40% see extreme heat events as a threat.
Several mass shootings occurred across the country before and during the survey period. Nearly 1 in 5 expressed concern over terrorism, with some specifying domestic terrorism and gun violence as a problem.
There is a knowledge gap in emergency preparedness.
- 14% are unsure how to make a household emergency plan
- 30% are unsure how to sign up for Larimer County alerts
Food & Housing
Nearly 1 in 3 adults have worried about affording nutritious meals sometimes or more often in the past year and 1 in 10 used food assistance services. Young adults, Hispanic or Latino/a/x residents, and lower income households most needed food assistance.
Chart 17. Food or Meal Assistance Access

More adults worried about paying rent or mortgage (2019: 17% vs 2022: 25%), although many fewer (6%) were unable to pay rent/mortgage at some time in the past 3 months. If they had to move out of their current home permanently, 7% "would not have anywhere to go.”
Chart 18. Financial Stress of Rent/Mortgage

How Characteristics are Reported
Gender:
Survey participants selected any combination of "Woman," "Man," "Transgender," or a written in gender. While people of many genders participated, low representation of transgender and non-binary residents restricts interpretive accuracy in some analyses.
Age:
Participants provided their age at the time of the survey. For this report, age groups of 18-34, 35-50, 51-64, and 65 years or older were used most often.
Race and Ethnicity:
Race and ethnicity were self-reported. Response options from previous surveys were continued, including space to write unlisted responses. Ethnicity was added among race options in one question where participants selected all that applied. Due to few responses from residents who are not White only or Hispanic or Latino/a/x of any race, "Other People of Color" may be used to regroup the remaining participants. Understanding and interpretation within this group are limited.
*Language of race and ethnicity presents many challenges. The Health District has ongoing discussions to improve language and understanding, and is open to constructive, inclusive conversations.
Income:
Participants selected household income for 2021 from ranges up to $125,000 or more. A calculation of income and the number of people who reportedly depended on that income was used to estimate the household's percentage of the Federal Poverty Level (FPL).
Acknowledgements:
The Health District of Northern Larimer County thanks the City of Loveland and the North Colorado Health Alliance for their financial support of the survey.
Thank you also to the survey respondents who took the time to share their thoughts and perceptions about health and well-being in Larimer County.
For more information and deeper analyses into particular topics, visit
https://www.healthdistrict.org/community-health-assessment
We welcome questions and comments. Please contact the Research & Evaluation team for more information about the Community Health Assessment.
Email: survey@healthdistrict.org
Phone: 970-224-5209